Thursday, January 14, 2016

Waiting on the Buy

Good evening!

I took a few days off from any updates because nothing had really changed from my perspective. This seems odd as there has been so much volatility in the market lately. Basically the markets have been getting slaughtered over the past few trading sessions. In my previous post I discussed how the XLE is in a long term downtrend. This has proven true as energy has been hit hard. Not good for me. I'm still holding my ERX even though it's a significant loser. Today was nice, but as I'll discuss later, it is likely short lived. The SPY and Q's however, are not quite in a long term downtrend. We have not fallen below the lows from August, which leaves them on the table for me as potential longs.

The chart above is XLE on a 15 minute period. The red line is showing the area I expect this bounce to reach. This is around the 58.25 area. While that's the area I'm looking at, today we actually reached an area for an intermediate term top. We can still move higher, but this will probably not last. I am not a short seller here though, that time has passed for me. So for now, we just wait and see what happens.

The chart above is a 15 minute SPY. Again I've shown the red line indicating where I believe this move is heading, which is around the 200 level. This bounce has been intermediate term playable, but I chose not to participate. Now, here's the interesting part... As I stated above we are not actually in a long term downtrend yet. Lets say we move upward tomorrow maybe again to the 195 area, move back lower but form a higher low, I would be willing to enter a long term long trade. As for now, we wait. Boring, I know.

The chart above is a 15 minute QQQ. Similar to SPY, the Q's are not yet in a long term downtrend, so I am looking at this area for a bottom. Oddly enough, if we break the red line, or the 106 area, I will enter a long position on the Q's. While I don't feel extremely confident about this, it's what the chart is telling me, and the point of this blog is to hold myself to the strategy. This would be a long term trade, likely over a month holding period. I will post any moves to Twitter and this blog. So stay tuned, but for now we wait.

Thank you all for reading!
Good luck tomorrow.

TraderSchmo

Saturday, January 9, 2016

Weekend Update

Good Morning!

Friday's action was essentially a continuation of what we saw all week. A complete beat down across the board. My position in ERX continues to get slaughtered, but as I've said before, I'm not going to exit until I get some sort of relief rally or maybe even a trend change. The problem with continued trends like this, whether bull or bear, is that if you get stuck there may not be any relief for quite some time. So I'll just wait. I currently do not have any orders pending, that is, with buy stops set. I missed the bearish trade, and it's too late to get in the game now. Which honestly doesn't make for exciting trading, but it preserves capital for when I want to jump in.

I want to add something that I realize I probably haven't discussed yet... My time frames for trading.

"Short Term" - These trades are signaled with 2 or 1 minute charts, and the trend usually lasts a day or two. I usually do not trade these except with options on rare occasions. They are very useful though to indicate longer term trades.

 "Intermediate Term" - These trades span over a period of about a week and sometimes a couple weeks. I will trade these, but they are not usually profitable enough to cover commissions in a small brokerage account.

"Long Term" - These are the trades I most frequently use. They occur over periods of a month or more, and are signaled by intermediate term trend changes.

I'll give an update on XLE, the energy sector.

The chart above is a 15 minute XLE. I had tweeted late in the trading day that there was a potential short term trend change to bounce to the 58.20 area. I still believe this will happen in the near term, however a move lower Monday morning could negate that. At some point there will be a bounce, and that will be the area I'm eyeing. The longer term chart is so damaged that right now I can't make an argument that we see a longer term trend change. We need some sort of bullish confirmation in the intermediate term, and even then the long term downtrend is intact.

The above chart is of SPY on 15 minute. Again we see a significant intermediate term downtrend. I'm still eyeing the 200 level for a bounce, but as of Friday's close there was no indication of when that would occur. The long term trend is bearish, but this is a funny situation. If we form and intermediate base here, we could see a longer term trend change. I'm definitely eyeing this as a potential trade.

The chart above is QQQ on 15 minute. I am most excited for the Q's from a bullish perspective. Even after the enormous beat down in late August the long term bull trend is still intact. An intermediate base here would signal an entry for a long term position that I will absolutely be playing. My best guess is that we bounce to the 110-ish level, then form a higher low. Then a break of that 110 would be my entry into a long term trade. Take that with a grain of salt as intermediate trends can continue in either direction for longer than you think. You need confirmation, and we haven't had it yet.

The chart above is the GLD on 15 minute. I like to occasionally include some of the other ETF's I look at. Last time it was the VNQ, this time its GLD. Gold is actually in a long term down trend. This said, it is making it's way toward an intermediate top, but it still has a long way to go. This intermediate trend will likely continue, but it is possible to reverse course. I think this is interesting as SPY and QQQ have reached what I would consider areas to watch for intermediate term trend change leading to long term trade opportunities, but GLD still has room to the upside - meaning the SPY and QQQ could continue lower and potentially into a bearish long term trend. Did that make sense? Hopefully. No trades are currently being looked at for GLD, but I keep an eye on it.

I hope you all enjoyed, and hit me with a follow if you'd like updates on the blog.

Have a great weekend!

TraderSchmo

Thursday, January 7, 2016

1-7-2016

Good Evening!

Wow, what a fucking blood bath today. I'm getting absolutely killed on my ERX position. As of the close I'm down about 19%, which is pretty brutal. It just makes me more upset that it was a trade where I didn't follow my trading rules. Then again, there is a bright side. Sometimes you need to get your ass handed to you to motivate you to do better. It's not a huge position, so the money isn't a huge concern (house money from last year), but the fact is that I've been wrong. Very wrong. But we move on. And it motivates me to continue this blog to keep me on the straight and narrow.

Lets get to some ETFs that I keep my eye on. I'll discuss the charts for XLE, SPY, QQQ, and VNQ for tonight, and potentially where I believe they're heading. Honestly, there isn't a lot of good news from the charts if you want to be bullish, so my general recommendation is dont be. However, I have the feeling that it may be too late to enter bearish positions. This is just a feeling and not backed by any of my indicators. We know where feelings have gotten me so far...

We'll start with XLE as I have the 3X Bull ETF.

Forgive me, I'm  still trying to learn how to throw charts on here, so it's probably hard to read. The chart above is a 15 min for XLE. What I'm seeing (and everyone else) is that we're in a significant downtrend. Tomorrow may see a bounce, likely to the $58.25 area, and if I'm lucky we'll start to form a base. I tweeted last night that I needed to see a break of 60.73 to enter the remainder of my position in ERX. We didn't get there, so the order wasnt filled. Good thing. As of now, I will continue to hold my half position because I mostly want to see where it takes me. But theres no way I'm adding until we see some sort of base form. 

SPY
The chart above is a 15 minute SPY. Similar to XLE, the SPY is in freefall. Oddly enough, according to my strategy we needed a day like today to wash out the weak hands. We may see a bounce to the 200.00 area, which is actually significantly higher than where we are now with all the volatility. It could present an opportunity for some, but I will likely sit out. For that I would need to see bullish confirmation on a short time frame, and this would only be a short term swing trade. Honestly, right now to get intermediate term bullish I would need to see a break of 208. We'll likely see a lower entry point for intermediate trades. Any trades made on this will be posted.

QQQ
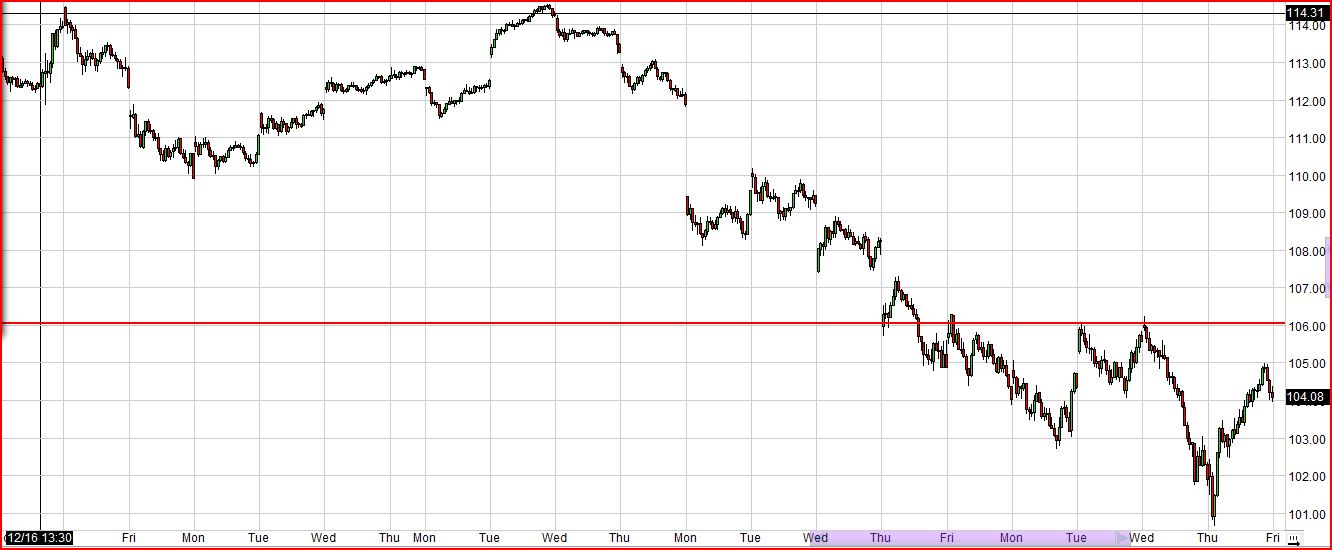
The chart above is a 15 minute QQQ. The Q's are actually a lot stronger than they appear in my opinion. We could see a bounce to the 110 area, which again offers an opportunity. I am expecting to see a lower high form down here probably tomorrow, and then potentially a base. This would offer an intermediate bullish opportunity. I do feel most bullish about the Q's though, so definitely something to watch. 

VNQ
VNQ is a REIT fund ETF that I like to watch mostly to see correlation between how this performs and the real estate market in my area. I'm hoping that I could potentially use it to score some cheap real estate near a bottom. This is a daily chart for VNQ, which I included half for fun. I'd like to point out that from here we have two options. I guess we always do. But we could go lower, form a higher low, and start making a move upward. I probably won't be trading this, but it's interesting to look at. The alternative is that we continue lower, and confirm the downtrend again. For that we would need to see a break of 72.00. This is more likely the case, but right now it's too difficult to make a trade either way. 


As always, any trades made will be posted to Twitter and StockTwits. I hope you enjoyed the read. Fill out the subscriber stuff on the right if you want updates when I make a new post. And please, if you want to discuss any trades or ideas hit me up on Twitter or StockTwits.

Have a good evening and good luck tomorrow!

TraderSchmo

Monday, January 4, 2016

Energy Holds Up

Good Evening!

The unpredictable nature of the market has always fascinated me. It seems the same thing never happens twice, yet you'll see plenty of people giving recommendations on patterns and comparing what's happening now to past events. The reality, or I guess my reality, is that it's impossible to predict the market based on past results. I've tried. I've gotten lucky. Then I failed. To me, the only way to have success is to develop a strategy, and use it with real money. Then realize your strategy sucks, and scrap it. Spend countless hours at your day job developing a new strategy, find that it works sometimes, and then adjust. And adjust... And keep adjusting. And if you're lucky, you'll find something that works for you.

Then a day like today comes along. Which either destroys or semi-validates your strategy. Luckily for me, I'm a small step closer to actually believing mine.

Okay.  I've rambled too long, but I wanted to make some sort of market commentary. Maybe my post dinner beverage has me philosophical... I'm done.

Now for an actual trading update...

Still holding my position in ERX from $24.00, and I likely will be for some time. I actually placed an order to add the other 50% of my position at $23.93 if/when we get there. The strength of the energy sector made me feel a bit better about that.

You may ask, "well, why not just buy it cheaper now?". My answer is, I need to see confirmation that this downtrend is coming to an end. I've been burned in the past by getting in too early, and missing a few points at the bottom is worth it to me for the peace of mind I get when I'm confident in a position. It goes back to my strategy. See that? Tied it back to my ramblings...

So... Bottom line is, I'm feeling good about the energy sector, but need to see confirmation before going full boat long.

Just for kicks, China... Stay the hell away.

Have a great night and good luck to all tomorrow!

TraderSchmo

Sunday, January 3, 2016

New Year's Trading

Hello Everyone,

Confession time... I haven't been diligent about this blog as I wanted to. So my new year's resolution is to devote more time to this. My reasoning is mainly to force myself to follow my rules more strict. Last year I entered a lot of positions that were sometimes profitable, but not always correct as far as my system goes. I finished the year with am 11.18% gain. While thats respectable, I could have done better had I followed my own rules. Not following my rules has me in my position in ERX, the 3X Energy Bull ETF.

I still like my position, but I just would have been waiting still to enter. I entered the position at $24.00, which puts me down about 2.4%. The reasoning for waiting on this position is that at this time I'm not sure if the energy sector will continue lower, or is forming a bottom. I like to see confirmation before I enter. But here we are.

Above is a daily chart of XLE, which is what I use to determine entries and exits.  We see a potential bottom forming, but it isnt verified yet. Being that we're in a downtrend, it isnt safe to enter a long position until a new uptrend is confirmed. 


The chart about is a 15 minute XLE chart. I included this to show the level I would have needed to see broken to normally enter my long position. We came close to this level, but did not break it. The new level is not the most recent high, or about $62.30.

I generally do not speculate on issues that could change these trends. Frankly, it's irrelevant to me. I simply wait until conditions are met and enter positions. This post is not as detailed as future posts will be, but considering I entered the position by not following my rules, there isn't much to say. We just wait until the position is verified.

I intend to post entries and exits to Twitter, so please follow if you're interested in the positions. I will then post a new blog at each position change giving my reasoning the following evening. I hope you enjoyed this, and will come back in the future.

TraderSchmo

Thursday, June 25, 2015


6-25-2015

Good Evening,

First, I'd like to thank you for taking the time to check out my blog. I've tried this before, but failed after just a couple posts. Hopefully I have more success with this one. This blog has multiple purposes for me. As every trader knows, you need to have rules and you have to stick to those rules. At times following those rules can be difficult, but posting my ideas here will help to keep me honest. Additionally, I simply enjoy hearing other people's feedback on trade ideas. To tell the truth I don't put any stake in what anyone else says, but a discussion is always fun.

My strategy is purely technical. But I typically dont care about Fibs or trend lines or whatever. To me it seems those techniques are violated easily and force you to miss out on some profitable trades. I use a combination of technical indicators that work for me. However, I intend to only give suggestions on any positions I am in or should be in considering what my indicators are telling me.

I try to only trade a few of the large ETF's, and occasionally an individual stock. My favorite and most profitable indicators have been SPY, QQQ, and IWM. I will focus on these in this blog.

Okay, I'm tired of talking about me already. I can talk more about that later. Lets get to it.

SPY

I usually trade SPXL when trading the S&P 500. The strategy is pretty basic. If we're in an uptrend, buy the dips and dont short (typically). My indicators still say we're in an uptrend dispite the chop recently. I'm currently long SPXL at 90.16, with a sell stop at break even. I expect us to make all time highs before I close my position, but that isnt set in stone. My strategy consists mainly of setting your sell stops, and keep an eye on shorter time frames to determine your price target. In my case I like to use a daily chart for determining trend, and 15 minute to find my sell point when other conditions have been met. As of right now, the upper conditions have not been met, so we keep our sell stop at break even and wait. Keep it simple.


QQQ

I do not currently have a position in the Q's, but when I do I usually trade TQQQ.

IWM

I really enjoy trading IWM. Good action, exciting stuff. I use TNA for long positions on the Russel 2K. I entered a long position at 82.68 in TNA, and actually sold the position today at 10:30 when the sell conditions were met at 96.33. A gain of 16.51%. This does not necessarily make me bearish, but I will be waiting on the sidelines until an opportunity comes up.


 I'm sure this post needs work, but its a start. Please bear with me ;)

Thanks again for reading.

-TraderSchmo